 - fractional citation tool
Help
Video manual
The same procedure can be used to build a complete (and very deep) bibliometrics profile of any life science researcher even if he/she does not have a Google Scholar profile. You just use one of his/her publications as a "fishing pole" to get other publications ID from PUBMED. Then you paste PMIDs into fCite alongside all combinations of name and surname and the profile is built within the seconds.
Gathering data for fCite
The same as above but in more traditional/expnded wayfCite can use either ORCID or PUBMED ids. It is highly recommended to use PUBMED ids. While the process of acquiring PMIDs has to been done by the user (there is no automatic procedure built into fCite), it is an easy task. Additionally, it provides some assurance that you are using the proper data (aka you know what you are doing).
You can start from the title of a single publication by given author (e.g., taken from the CV, grant application, or Google Scholar)
For instance, let's assume that you are interested in the publication entitled "Proteome-pI: Proteome Isoelectric Point Database". Then you want to know more about the author (for the sake of simplicity assume that you cannot or do not want to use Google Scholar profile information or/and you want to obtain more detailed statistics):
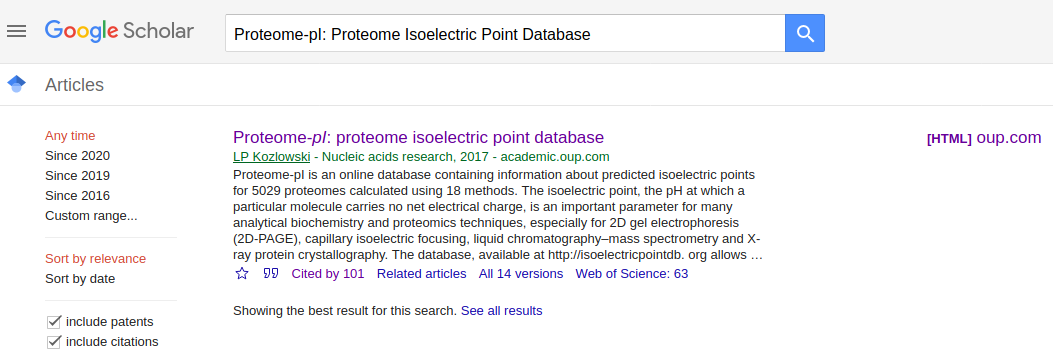
Go to PubMed and make a query ("Proteome-pI: Proteome Isoelectric Point Database")
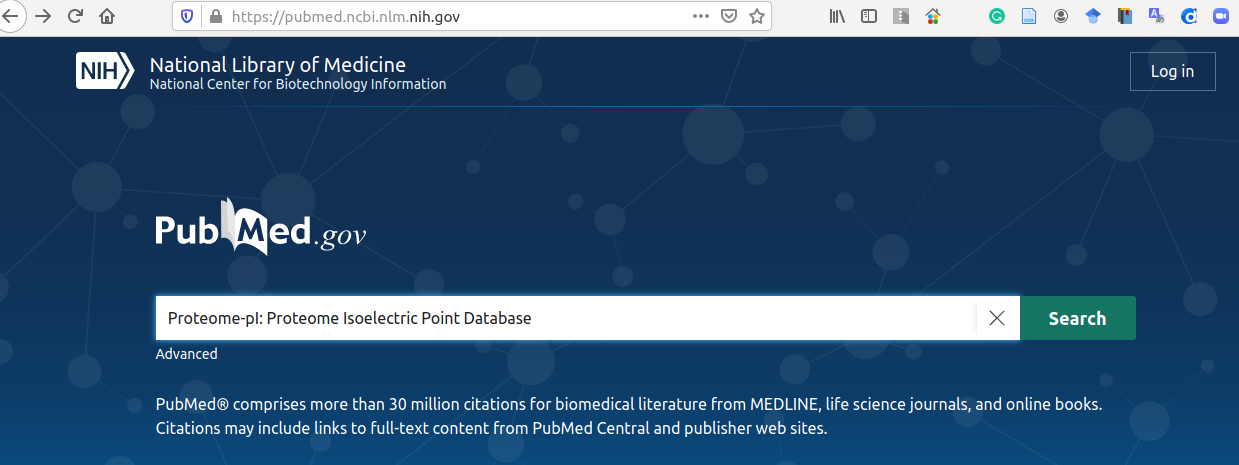
Usually, the title is sufficient to find desired publication (it will be near the top of the list). Now, you
click on the proper item.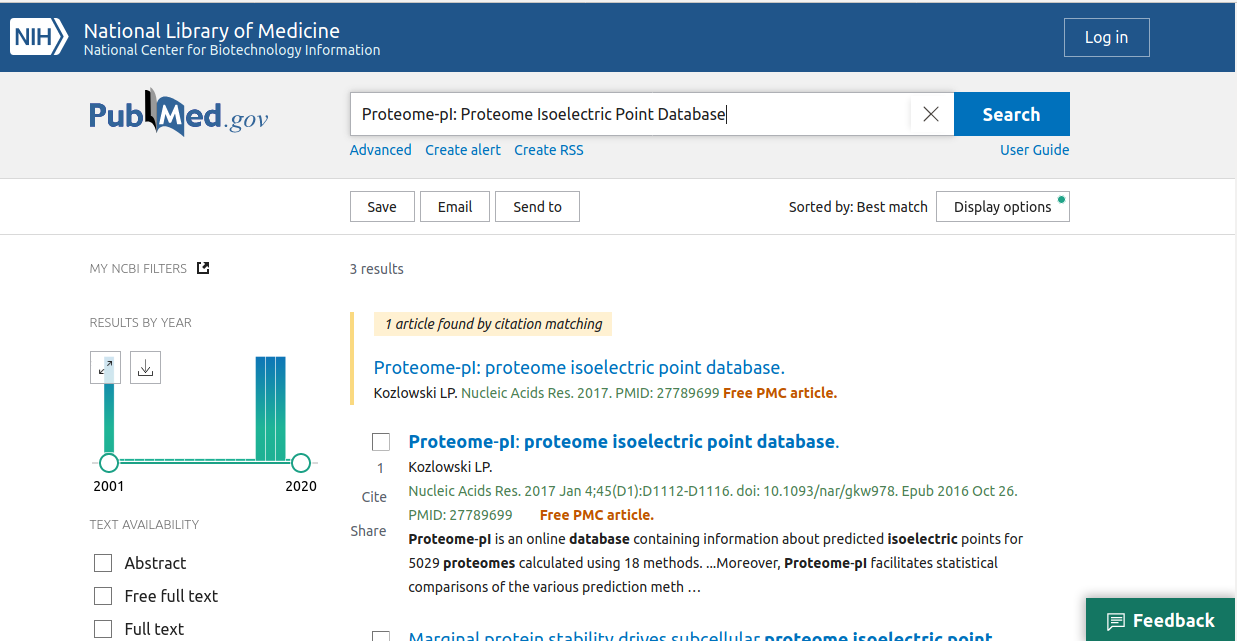
Then
click once more on the author you wish to analyse (here, it is only one author)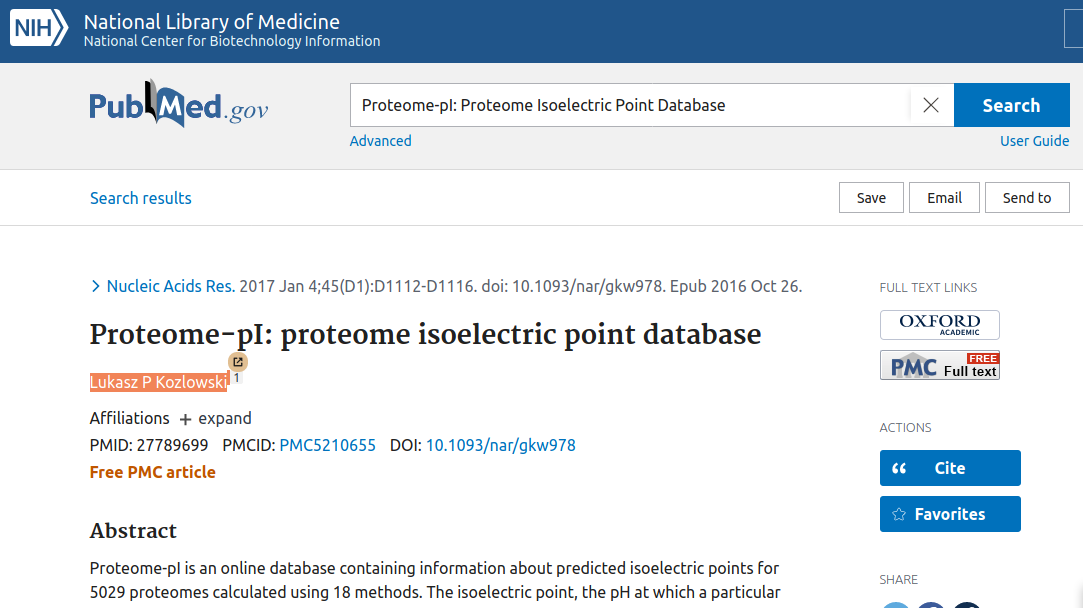
Next, you will see is a list of all PUBMED articles authored by given author.
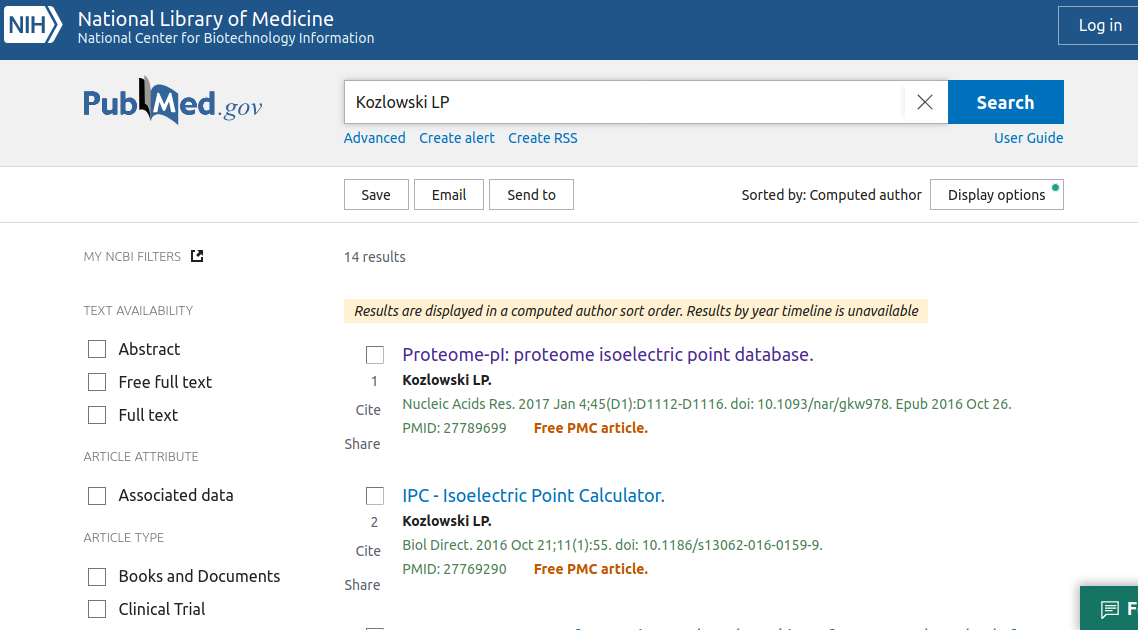
In this example you get a list of publications by "Kozlowski LP", which currently contains 14 items).
Important remark: Author lists in PUBMED have some internal logic behind them, and thus the query will also return some of the publications where there is a "Kozlowski L" or even "Kozłowski Ł". On the other hand, you can obtain a lot of "contamination" (especially if the name is popular), meaning that this person is not a match and you will need to correct/verify the resulting list. You need to be careful. You can limit the results by restricting findings to a given period (e.g., you know that somebody did not publish before, e.g., 2010), or you can directly remove the items from the list if you know that they do not belong to the author (e.g., you analyse a biologist and then get some publications in physics). This is where some insight from you is needed. This is not very hard, as usually you have the CV of the person in question, or the errors are easy to spot, e.g., the wrong name. After a few trials, you will be able to do such filtering almost automatically.
Next,
click within "DISPLAY OPTIONS" on "Format" in the top left menu and change default "Summary" to "PMID".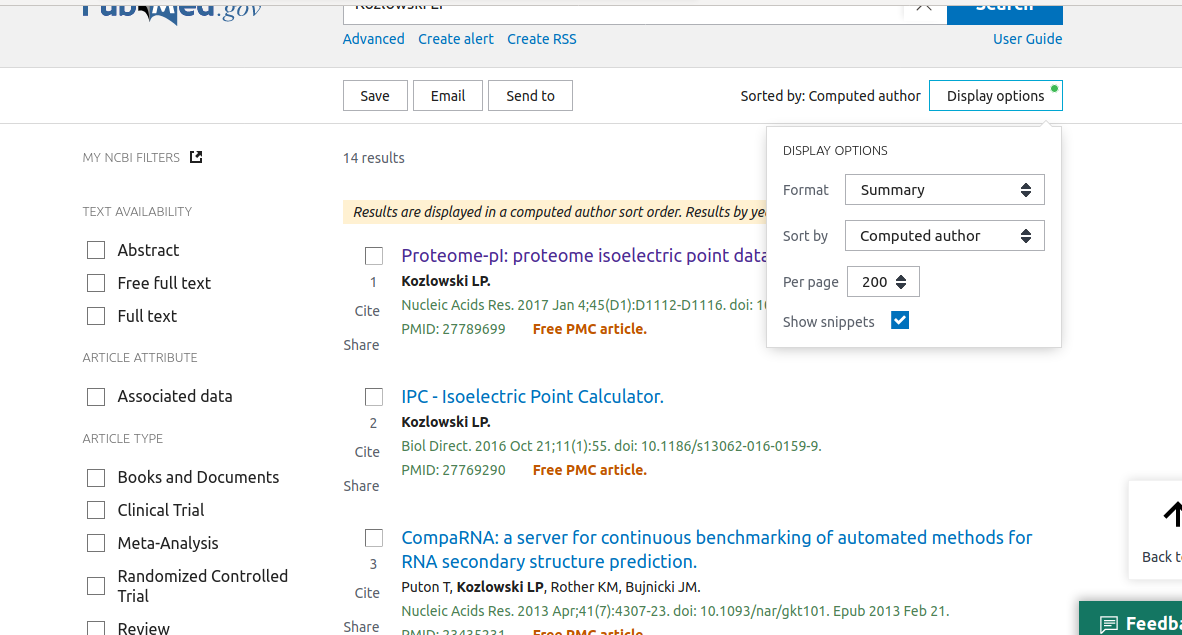
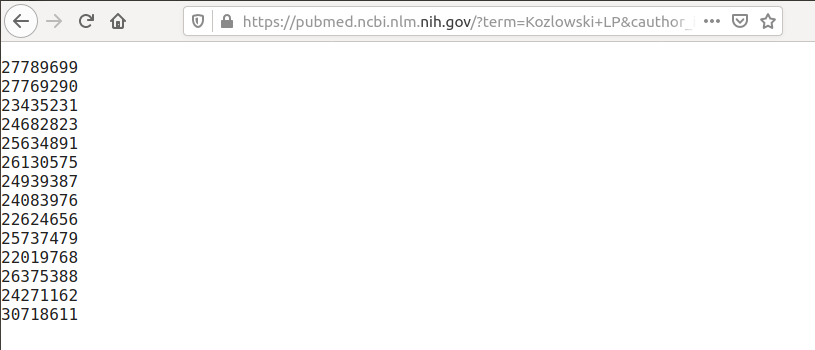
The result should look like this:
Note, that from time to time you will need to change the number of items to display
"Per page" (the default is 20, but you can get as many as 200 items, and you may need to repeat those steps for sublists of 200 items)
Now, you need to copy this list (
Ctrl+a and Ctrl+c) into the fCite form.
The result should look like this:
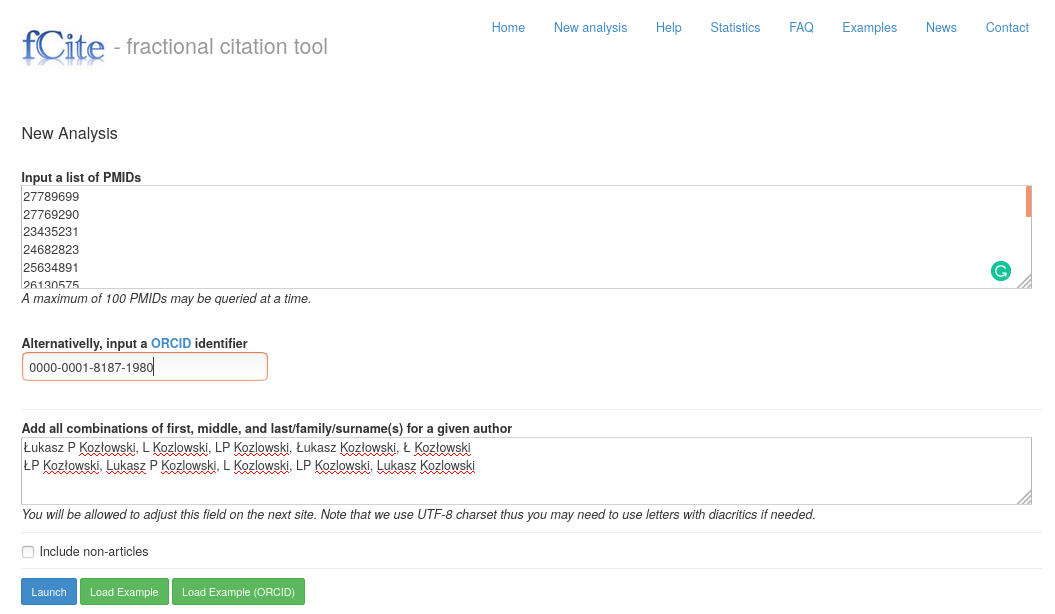
Notice: by default, fCite focuses on research articles; if you wish to also include non-research items (e.g., editorials, reviews and other), you need to check the "Include non-articles" checkbox (at the bottom of the form).
Interpretation of the results of fCite
As a result, you should obtain a similar panel: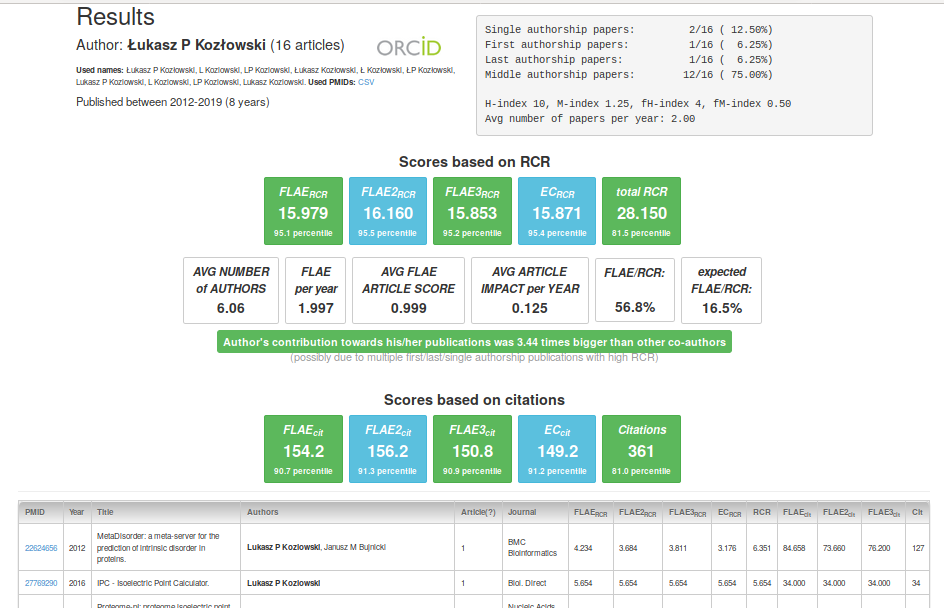
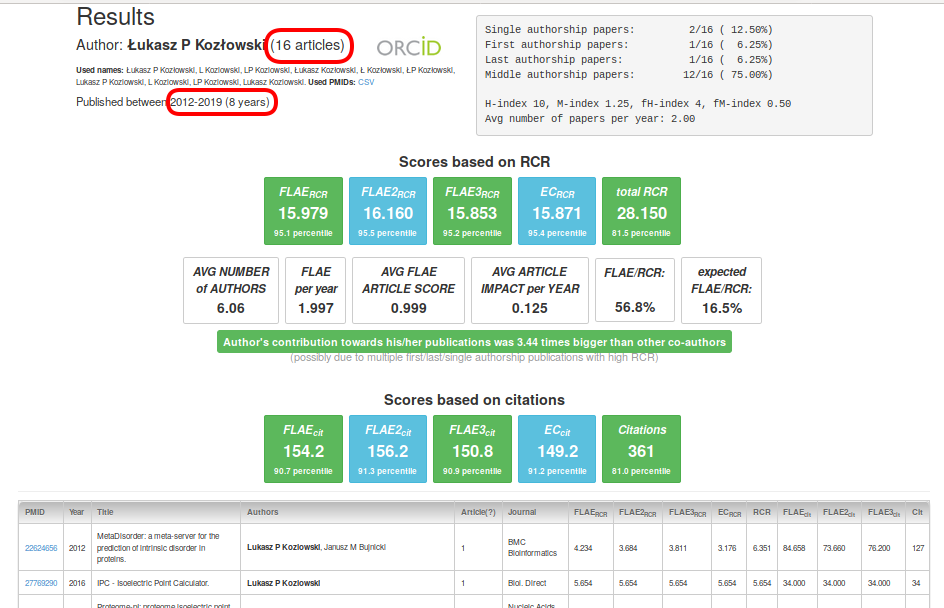
The two most important things in the top-left panel are the number of articles and the period of activity of a given researcher. These two pieces of information already allow you to guess the scientist’s position. For instance, up to ~5 years of activity means that someone is at the master’s or PhD student level, while a history of up to ~10 years means a postdoctoral position. Seeing anything more means you are dealing with a senior scientist/PI. Similarly, the more papers there are, the more likely someone is to be a senior scientist. Remember that publications do not aggregate linearly over time. As a master’s or PhD student, your options are very limited (one main project and maybe 1-2 additional projects; practically, you cannot choose the topic of your research). You spend almost all of your time on one or two major projects, and if you succeed, you will be the first author of one or two papers in the next 2-5 years. Next, as a postdoc, you have more freedom, you have more projects, and you can delegate work to master’s/PhD students. As a result, you became the co-author of many more papers (but usually not as the first or last author). Finally, when you start your own group that can grow each year (even up to 50 people; remarkably it seems there is some physical limit of ~50 people forming a single group, and after that threshold, group performance usually deteriorates). Thus, occasionally, you will see that (very) successful scientists can have hundreds of publications in their portfolio or/and even 50 publications per year (guess how this is possible). Nevertheless, one research publication per 1-3 years as a lead author (first or last) is something you should expect. From time to time, you may come across an exceptional scientist who is able to publish 2-3 research papers per year on his/her own or as the first author. In all other cases, you will notice that additional items are either multi-authored papers or meaningless papers (e.g., "salami slicing", producing items with low FLAE scores).
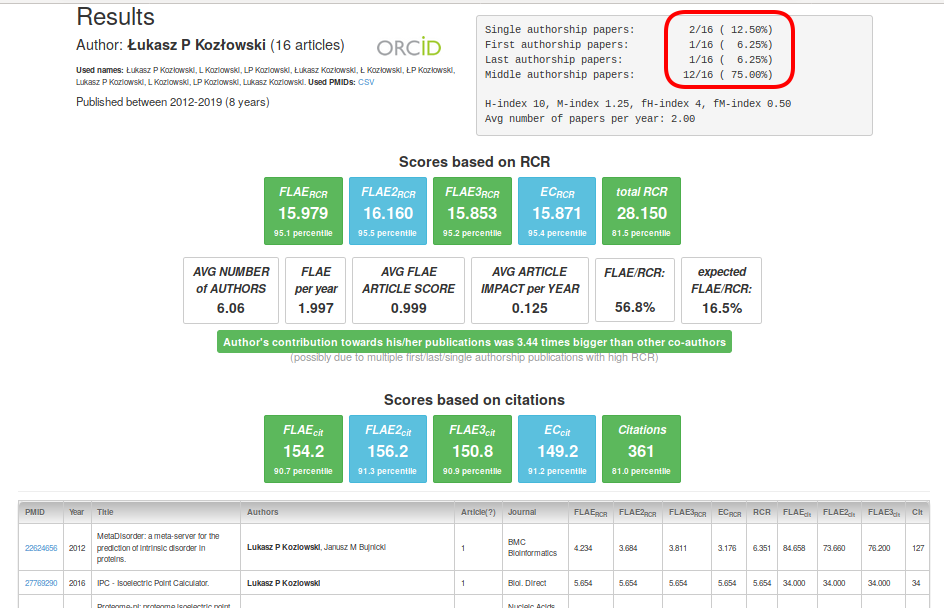
Let us look at the top right panel. You can find more interesting information there. You see how many single, first, middle and last author items are in the portfolio. This is very powerful information. For instance, single author research papers are extremely rare (for details see Statistics; usually you will see zero here, especially if you filter out non-research items). You can also see the number of the first author papers where someone played a leading role in the execution of the project. Last author papers mean that someone is already a senior scientist. The relative numbers of all those types of publications provide background about the analysed author. Additionally, you have the information about the H-index and M-index and their fractional derivatives. Note that those scores are not very informative, as they do not discriminate among portfolios very well (e.g., single-unit increase in the fH-index can take many years). In essence, if you have to use those scores, use them in this order: fM-index > fH-index > M-index > H-index (where fM-index is the most informative).
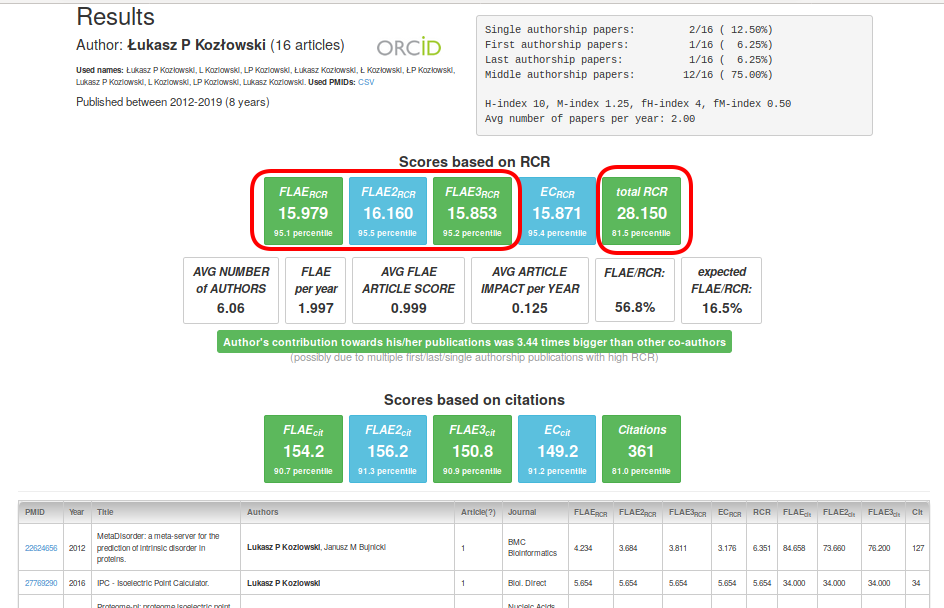
Next, we move to the central and the most important part. Panels based on RCR and citations are very similar in meaning, and they present five scores. FLAE, FLAE2, FLAE3 are the most important metrics that reflect the influence of the author (without other authors contribution). The EC score assumes equal contributions (simply the RCR sum divided by the number of authors). Total RCR is a sum of all RCR scores in the portfolio (regardless of whether the item has one or one hundred authors). Note that increasing total RCR (or citations) can be done relatively easily (for instance, by increasing the group size, participation in consortia, etc.). However, it is extremely difficult to increase FLAE scores.
Moreover, the more senior the author is, the more importance should be placed on quality rather than on quantity. Therefore, you may find it useful to analyse scores such as "FLAE per year", "Avg FLAE Article Score" and "Avg Article Impact per Year" (those metrics are very robust and hard to inflate).
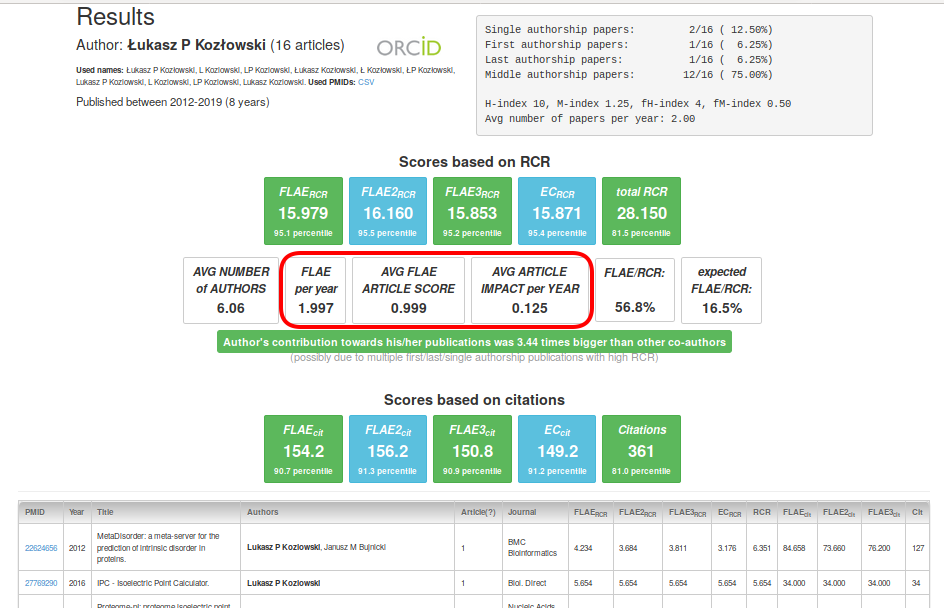
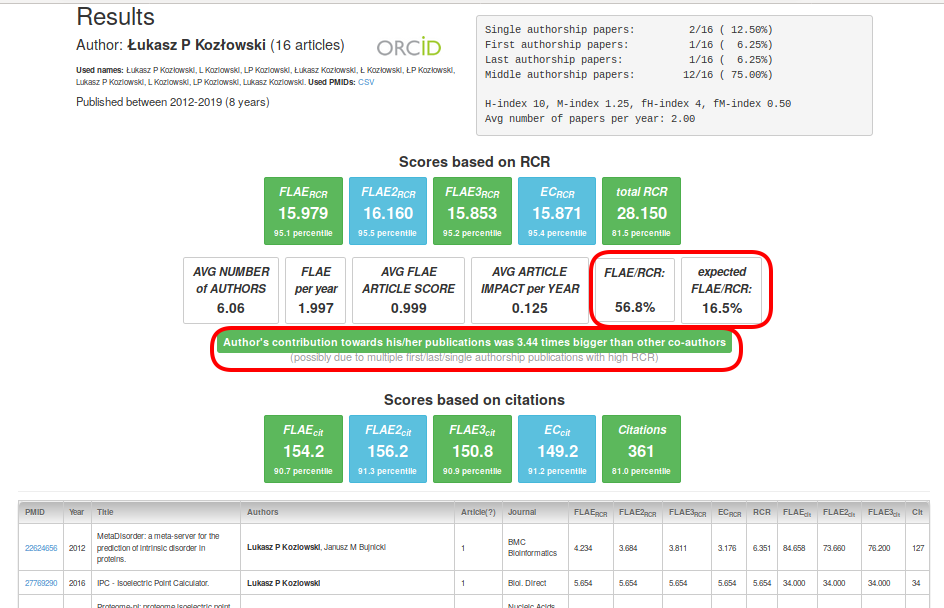
Next, an interesting metric is the "FLAE/RCR" ratio, where you can assess the average contribution of a given author with respect to the number of authors in the total portfolio. The 'expected FLAE/RCR' is calculated by considering the number of all authors in the whole portfolio (this is equivalent to saying that all authors had equal input). Using those two measures, it is easy to assess how large the contribution of the author was in percentage terms (the thresholds used are 0.8 and 1.2, where the middle range is expected; someone who is a leader in his/her research has a score of more than 1.2, and supporting authors are below 0.8).
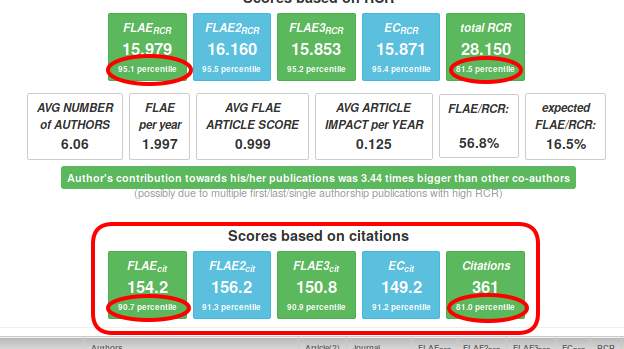
"Scores based on citations" are practically equivalent to those based on RCR, but RCR-based scores should be preferred because they have a very important advantage that they can decrease over time when the importance of the papers decreases as they start to become obsolete (while the citations can only aggregate). Moreover, they tend to capture at least some field diversity (for more details, read PMID:27599104, PMID:28968388, and PMID:28968381).
At this point you see some scores such as FLAERCR, but you do not know whether having a score of 15.979 (or any other) is good or not. To help judge this, fCite provides percentiles for all of these scores (calculated separately for research and all-item portfolios) which are based on ~600,000 ORCID users. Now you can easily say how good a given score is. Additionally, you can also compare percentiles of total RCR vs. FLAERCR to judge a researcher's importance in his/her papers.
Another interesting feature of the output is the table with the scores on individual items (note that the table is initially sorted according to the RCR score).
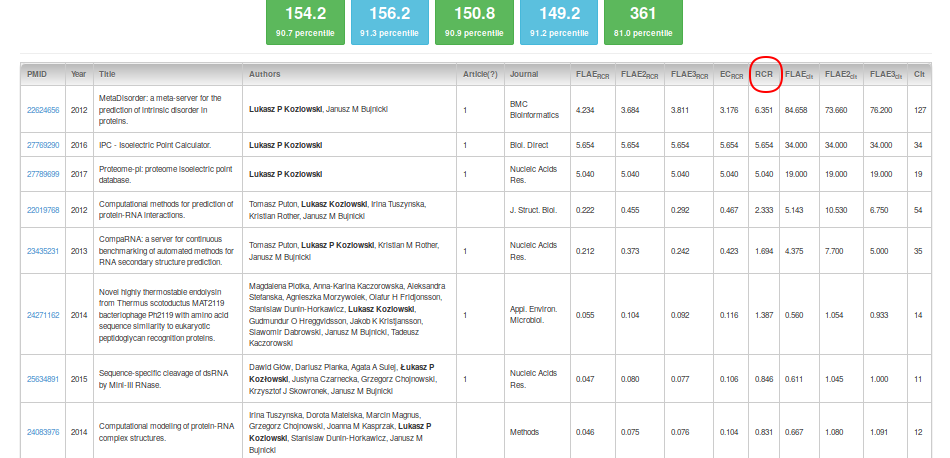
Obviously, by clicking on the column header you can sort as you wish (e.g., by FLAERCR).
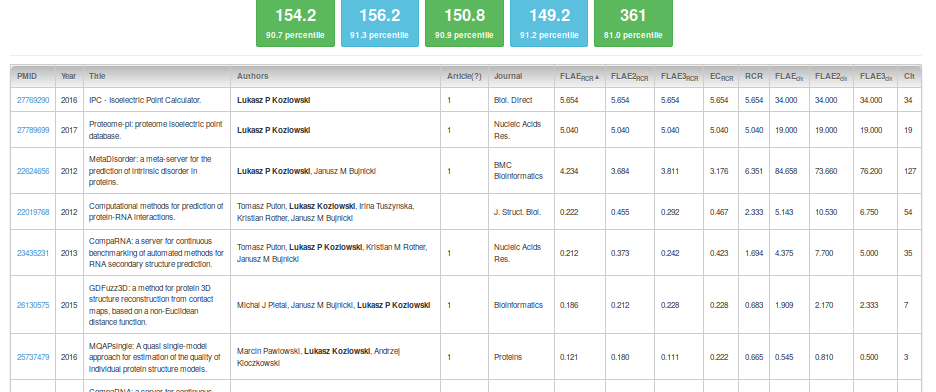
Note that RCR scores are calibrated in such a way that a score of 1 is the middle point with respect to the total RCR (any paper with RCR of 1.0 has an RCR higher than 50% of NIH-funded papers). On the other hand, for simplicity, all other metrics are not calibrated (thanks to the use of percentiles, this is not required). The more rigorous the metric you use, the smaller the score that is expected for a single paper. For instance, an FLAERCR of 1 is already between 96.6% and 97.1% of all and research-only items, respectively (which means that roughly only 3 papers out of 100 will have better FLAERCR scores).